Help Center
Dashboard Data Components
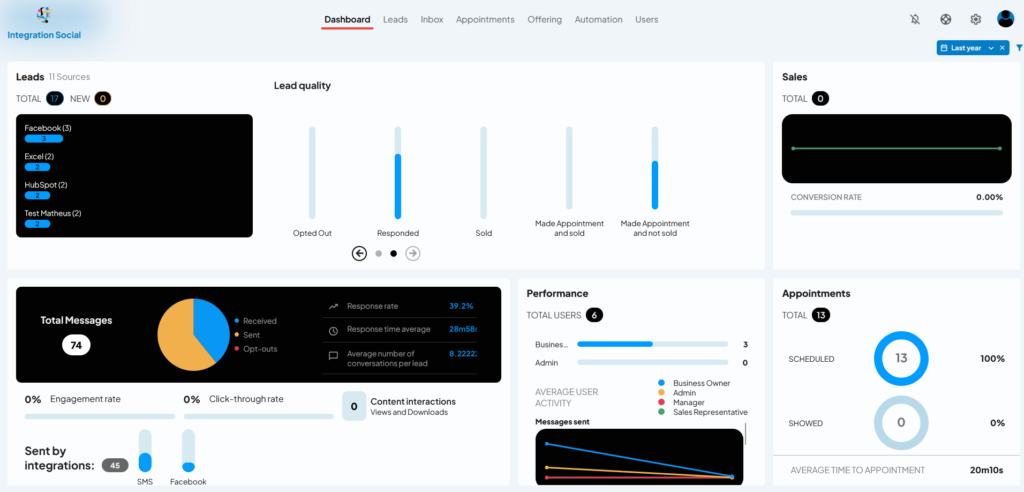
Introduction: The Dashboard Module in LeadIS provides an overview of your lead engagement, team performance, and appointment activity. It consolidates critical data into easy-to-understand visual components, helping you track progress and identify opportunities for improvement.

Key Data Components of the Dashboard:
Leads Overview:
- Displays the total number of leads, broken down by:
- Total Leads: The total number of leads in the system.
- New Leads: Recently added leads.
- Lead Sources: A breakdown of where leads originated (e.g., Facebook, Excel, HubSpot).
- Displays the total number of leads, broken down by:
Lead Quality:
- Tracks the journey of your leads with the following metrics:
- Opted Out: Leads that have unsubscribed.
- Responded: Leads that have replied to your messages.
- Sold: Leads that resulted in sales.
- Made Appointment and Sold: Leads that booked an appointment and completed a sale.
- Made Appointment and Not Sold: Leads that booked an appointment but didn’t convert.
- Tracks the journey of your leads with the following metrics:
Sales Metrics:
- Tracks the total sales achieved and the Conversion Rate (percentage of leads converted to customers).
Total Messages:
- Provides a breakdown of all messages sent and received, including:
- Sent Messages (orange segment in the pie chart).
- Received Messages (blue segment in the pie chart).
- Opt-Outs (red segment in the pie chart).
- Additional metrics include:
- Response Rate: Percentage of leads that responded.
- Response Time Average: Average time taken to respond to a lead.
- Conversations per Lead: Average number of conversations held with each lead.
- Provides a breakdown of all messages sent and received, including:
Performance Overview:
- Tracks team activity, including:
- Total Users: Number of active team members.
- Roles Breakdown: Displays the number of users by role (e.g., Business Owner, Admin, Manager, Sales Representative).
- Average User Activity: Visualized by the number of messages sent by role.
- Tracks team activity, including:
Appointments:
- Summarizes appointment activity:
- Total Appointments: Total number of scheduled appointments.
- Scheduled Appointments: Percentage of appointments successfully scheduled.
- Showed Appointments: Percentage of appointments attended.
- Average Time to Appointment: Time elapsed between scheduling and the appointment date.
- Summarizes appointment activity:
Engagement Metrics:
- Tracks engagement data, including:
- Engagement Rate: Percentage of interactions with your content.
- Click-Through Rate: Percentage of leads clicking on shared links.
- Content Interactions: Number of views and downloads for shared content.
- Tracks engagement data, including:
Sent by Integrations:
- Displays the number of messages sent via different platforms (e.g., SMS, Facebook).
Filters:
- Use the filters in the top-right corner (e.g., time range) to adjust the data displayed on the dashboard. You can refine metrics based on specific periods (e.g., Last Year, Last Month) for better analysis. (Detailed explanation of filters will be covered in a separate article.)
Tips for Success:
- Regularly monitor the Lead Quality and Sales Metrics to identify trends in lead conversion.
- Use the Performance Overview to ensure all team members are actively contributing.
- Analyze the Engagement Metrics to refine content strategies and improve lead interactions.