Help Center
Dashboard Filters
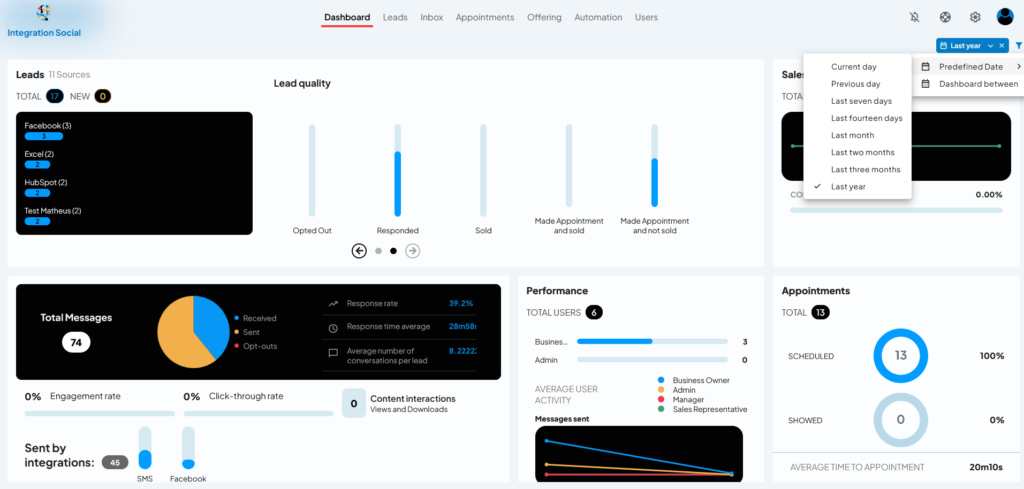
Introduction: The Dashboard Filters in LeadIS allow users to refine the data displayed on the dashboard based on specific timeframes or predefined periods. These filters provide flexibility in analyzing key metrics, enabling users to make informed decisions by focusing on relevant data.

Key Features of the Dashboard Filters:
Filter by Timeframe:
- Users can choose from predefined date ranges to view data trends and metrics over specific periods, such as:
- Current Day: Data from today.
- Previous Day: Metrics from the day before.
- Last Seven Days: Data aggregated over the past week.
- Last Fourteen Days: Metrics from the past two weeks.
- Last Month: Insights from the previous calendar month.
- Last Two Months: Metrics spanning the last two months.
- Last Three Months: Data aggregated over the past three months.
- Last Year: Metrics from the past 12 months.
- Users can choose from predefined date ranges to view data trends and metrics over specific periods, such as:
Custom Date Range:
- The Predefined Date option allows users to set a custom date range by selecting start and end dates. This flexibility helps users focus on specific campaigns, projects, or time periods.
Dynamic Updates:
- The dashboard instantly updates to reflect the selected timeframe, providing real-time adjustments to metrics such as:
- Leads
- Appointments
- Sales
- Engagement metrics
- The dashboard instantly updates to reflect the selected timeframe, providing real-time adjustments to metrics such as:
Easy Access:
- The filter menu is prominently located in the top-right corner of the dashboard, ensuring easy accessibility.
How to Use the Dashboard Filters:
Access the Filters:
- Click the dropdown menu in the top-right corner of the dashboard, next to the current timeframe (e.g., “Last Year”).
Select a Predefined Timeframe:
- Choose from the list of predefined options to instantly update the dashboard data.
Set a Custom Date Range:
- Select Predefined Date and use the calendar tool to specify a custom date range.
- Confirm your selection, and the dashboard will update to display metrics for the chosen period.
Analyze Updated Data:
- Review metrics such as lead quality, appointments, and messages to identify trends within the selected timeframe.
Tips for Success:
- Use Last Seven Days or Last Month to monitor recent performance and adjust strategies accordingly.
- Leverage Custom Date Ranges for analyzing data during specific campaigns or business periods.
- Regularly switch between filters to identify trends and anomalies across different timeframes.